The following Tableau embeds are provided as sample views of the initial P-EBT data set (Book 1). These samples offer multiple views of the data and address different perspectives based upon need.
Data Tables View
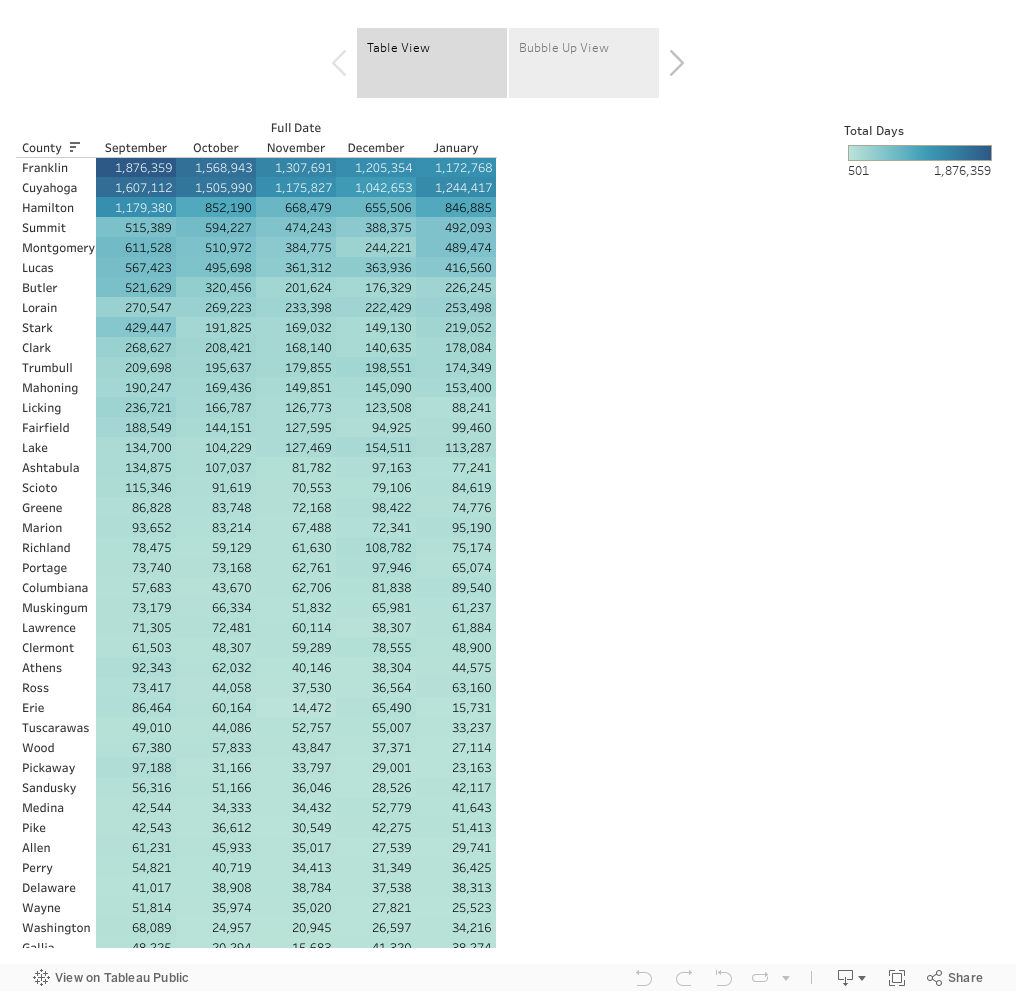
The “Data Tables” embed offers two views of the data for understanding totals over time (Sep 2020 – Jan 2021).
Table View list all data by County and Date and is sorted in descending order (highest to lowest total benefit days)
Bubble UpView list all data by Date and Total Benefit Days and can be filtered by County to allow for simple comparisons
Trends View
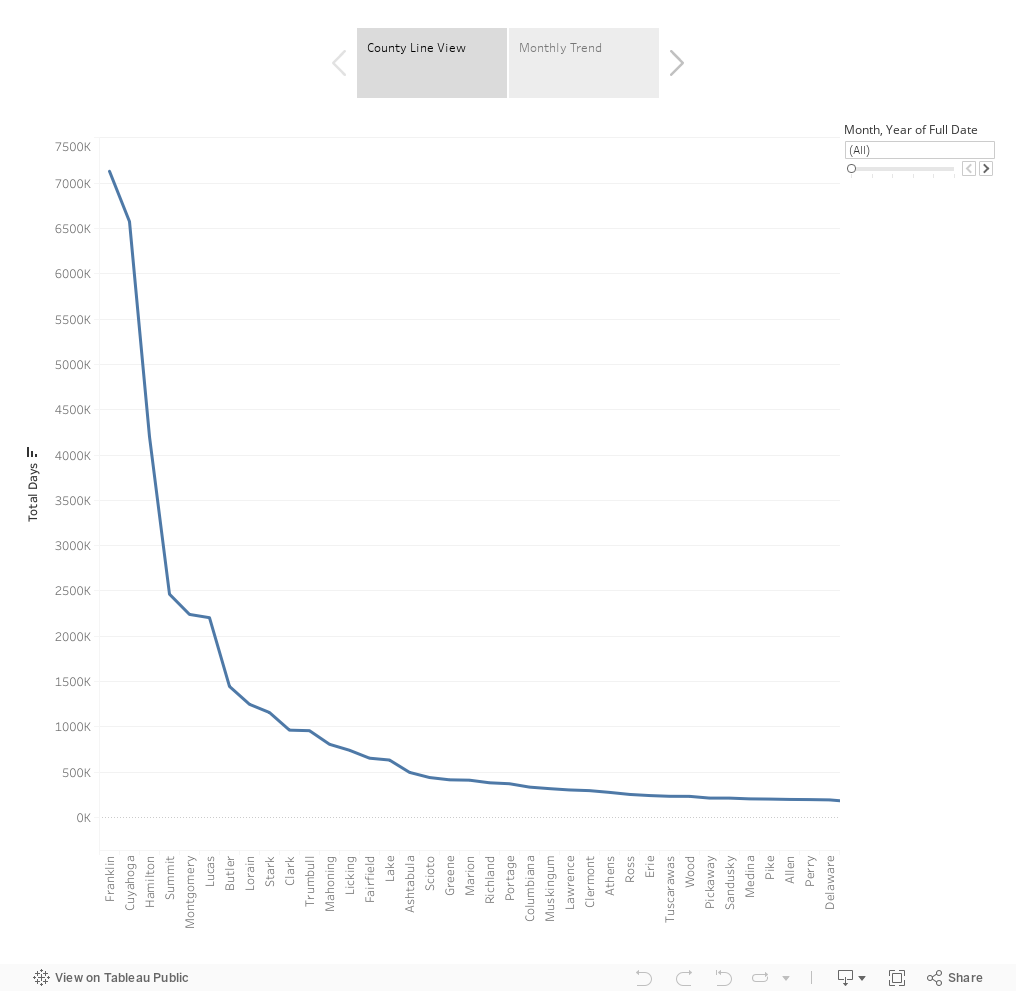
The “Trends View” embed offers two views of the data for understanding totals over time
County Line View list all data by County and Totals and is sorted in descending order (highest to lowest total benefit days by County) A filter is also provided to allow viewing of data change over time.
Monthly TrendView list total sum data for all sites (combined) by Date and shows general direction for totals.
Geographic View
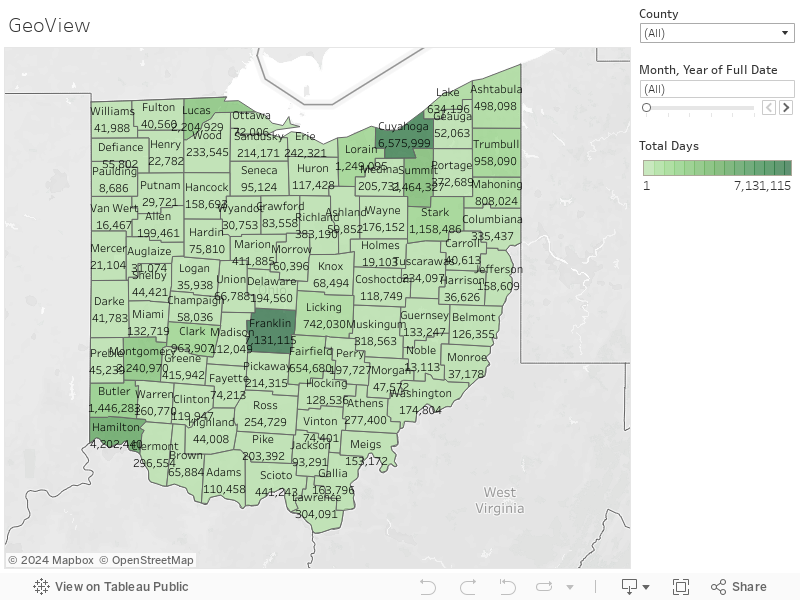
The “Geographic View” embed offers a map view of the County and Benefit Days Totals. The data contains a slider filter for viewing the change in data over time. A slider filter is added for Date and a dropdown selection filter has been added for County. Selecting county and using the slider will allow for viewing the change in data overtime for that specific location.